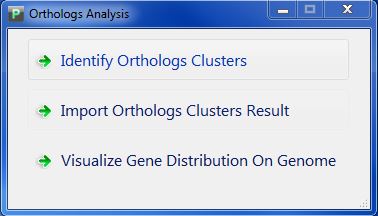
We also develop many user interacting functions in orthologs analysis part.
The first interacting function is the same as genome alignment, you can choose which genome to display, and set genome order, by clicking the menu part of "Edit"-->"Genome List".
The second interacting function is also the same as genome alignment, you can align the genome by nucleotide site, by double clicking a site with your mouse.
The third interacting function is toolbar, you can zoom in, zoom out, move right, move left, and go back to the initial state.

Go to initial state

Zoom in

Zoom out

Move left

Move right
There are also some new features in orthologs analysis part:
The first new feature is that we provide three color mode for painting ortholog genes: Gradient Color Mode, Three Color Mode and Four Color Mode. You can set in the menu "View"
In Gradient Color Mode, we mark the gene blue if its conservation value is 1, and red if its conservation value is N(N is the number of genomes), and the rest will have gradient colors in the range of blue and red. Figure 5.4.1 shows the visualization result in Gradient Color Mode.
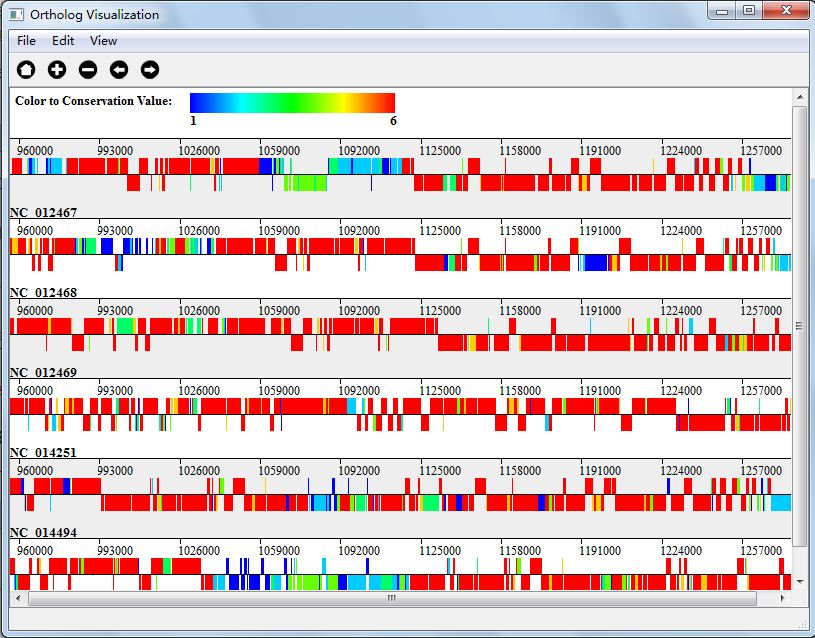
Figuer 5.4.1: Gradient Color Mode.
In Three Color Mode, we mark the gene blue if its conservation value is 1, and red if its conservation value is N(N is the number of genomes), and the rest gene will be marked as green. Figure 5.4.2 shows the visualization result in Three Color Mode.
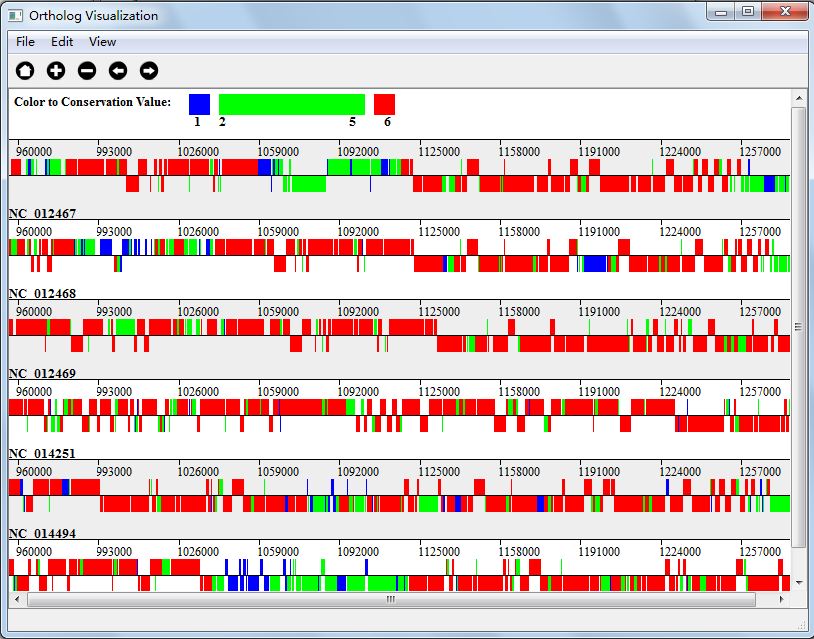
Figuer 5.4.2: Three Color Mode.
In Four Color Mode, we mark the gene blue if its conservation value is 1, and red if its conservation value is N(N is the number of genomes), and let M = N/2, we will give genes with conservation value from 2-M with one color and M+1-N-1 with another color. Figure 5.4.3 shows the visualization result in Gradient Color Mode.
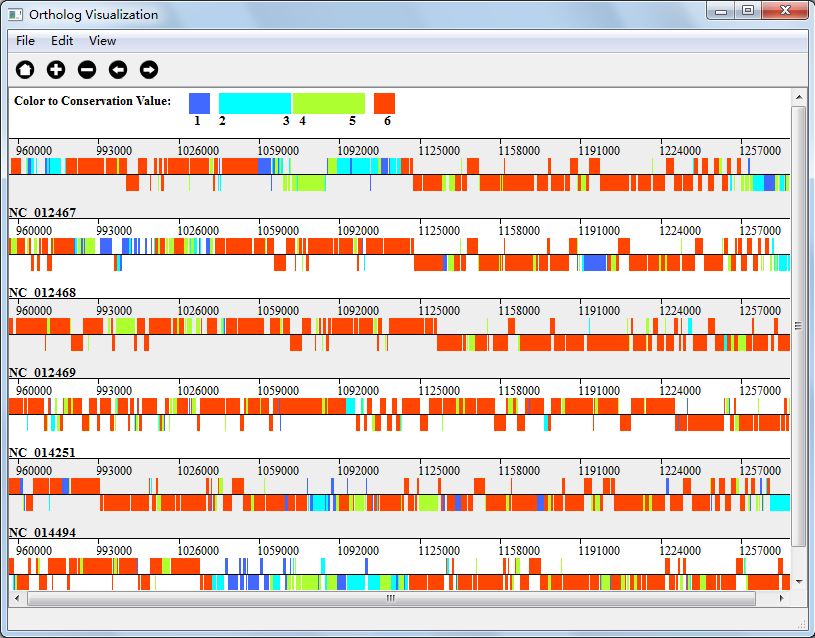
Figuer 5.4.3: Gradient Color Mode.
Another new feather in orthologs analysis part is that you can choose to visualize genes with specific conservation value. You can set in the menu "View"-->"Set Conservation Range" In Figure 5.4.4, we show genes with conservation value 6(if you remember, we analysis 6 genomes, that is to say, we show genes that all the genomes have).
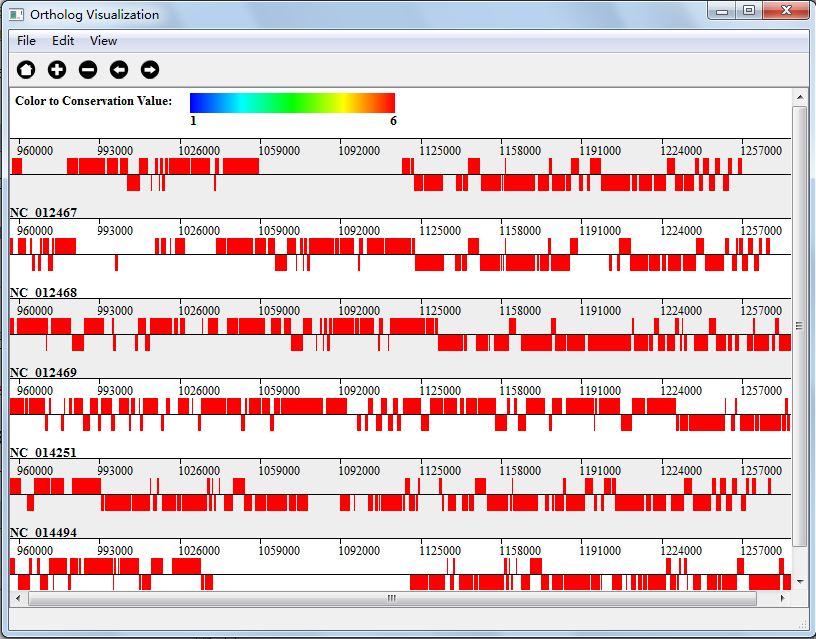
Figuer 5.4.4: Genes with specific conservation value.