Click button "Variation Analysis" in PGAP-X Lite Launcher, you will get the "Variation Analysis" interface like Figure 6.0.1.
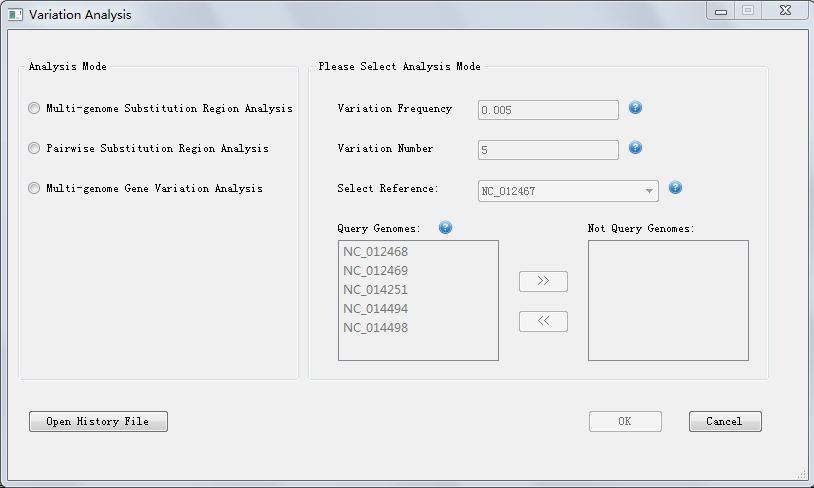
Figuer 6.0.1: Variation Analysis.
| You are here: PGAP-X Home > Manual > Get Genome Variation Result and Visualization Result | ||||
Click button "Variation Analysis" in PGAP-X Lite Launcher, you will get the "Variation Analysis" interface like Figure 6.0.1.
In Figure 6.0.1, we can choose to get the genome variation result, we provide 3 options:
When analyzing genome variation by region, firstly we set variation frequency and variation number, Analyzing genome variation by region contains two forms, first is Multi-genome Substitution Region Analysis, we analysis all genomes together, and we set the most frequent nucleotide as reference nucleotide, and site in genome which is different from the reference nucleotide will be defined as a variation. Second is Pairwise Substitution Region Analysis, we set a reference genome and set a query genome, and just analyze 2 genomes at one time. If the nucleotide of the 2 genomes are different, we define there a variation. And then we filter regions that contains variation frequency and variation number higher than the threshold that we set.
When analysis genome variation by gene, we also set variation frequency and variation number, and then we filter genes that contains variantion frequency and variation number higher than the threshold that we set.
At the begining, you have to choose the analysis mode, and then enter the corresponding parameters, then the button "Ok" will be available.
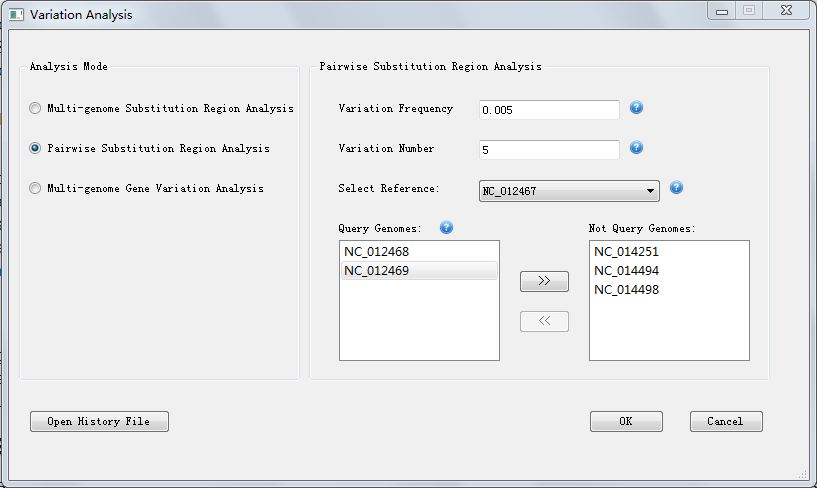
In option "Multi-genome Substitution Region Analysis" and option "Multi-genome Gene Variation Analysis" you need to enter the parameters "Variation Frequency" and "Variation Number"; while in option "Pairwise Substitution Region Analysis", you also need to choose parameters "Reference" and "Query Genomes", in Figure 6.1.1, we choose "NC_012467" as reference genome, choose "NC_012469" and "NC_014494" as query genomes, the visualization result will defaultly display reference genome and the first query genome pairwisely, which are "NC_012467" and "NC_012468".
Click button "OK", and it will take you a few minutes or hours depending on your data amount. When finished, you will find your result in the folder "GenomeVariation" in your workspace.
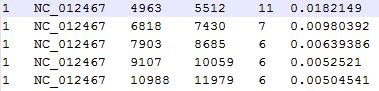
In mode "Multi-genome Substitution Region Analysis", you will get your result in file "MultipleGenomeVariation.substitution.HighSubstitutionRegion.txt", which are substitution region that meet the threshold you set. The result contains 6 columns, as you can see in Figure 6.1.2, the first column is genome Id, second column is genome name, third column is start position of the region, forth column is end position of the region, fifth column is variation number of the region and sixth column is variation frequency of the region.
When finishing genome variation analysis, you can get the visualization result immediately, you can also visualize history analysis result by click button "Open Hisotry File" in Figure 6.0.1., and we will talks bout the History File Visualization in 6.4. Read and Edit History File
Figure 6.2.1 shows the visualization result of Multi-genome Substitution Region Analysis; Figure 6.2.2 shows the visualization result of Pairwise Substitution Region Analysis, and Figure 6.2.3 shows the visualization result of Multi-genome Gene Variation Analysis.
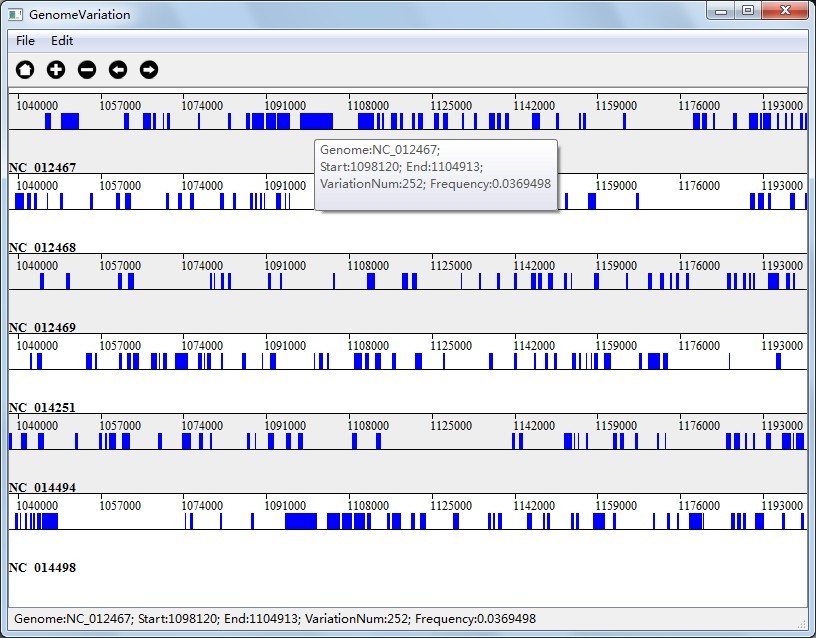
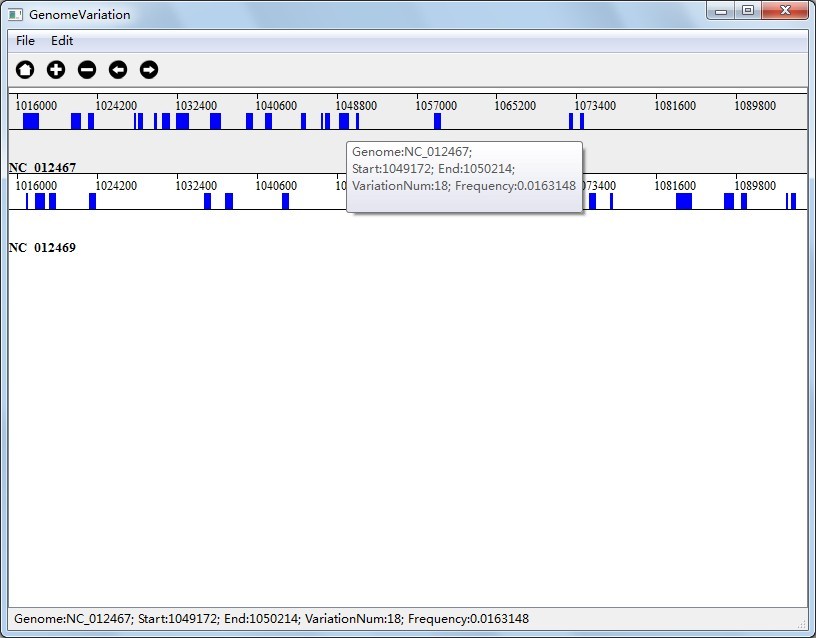
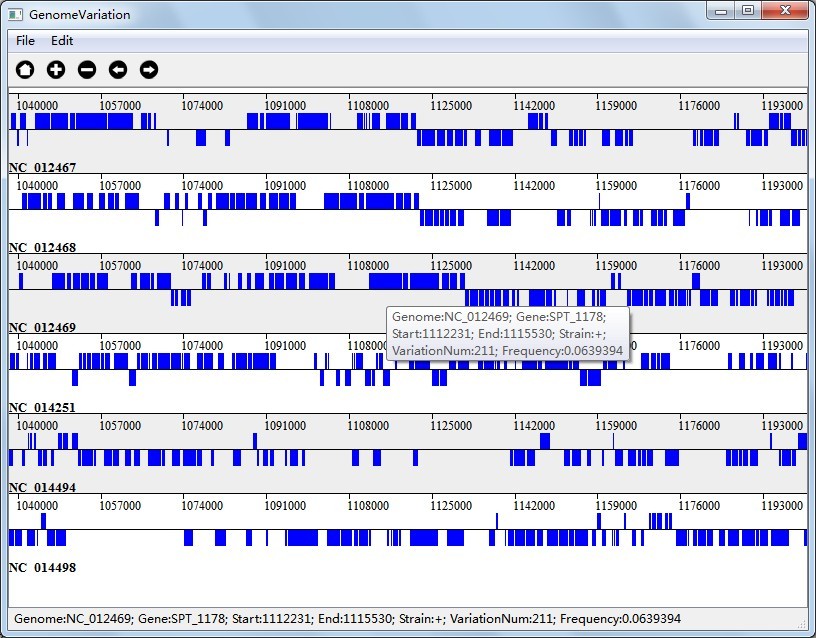
In Figure 6.2.1(Visualization Result of Multi-genome Substitution Region Analysis), the colored rectangle represents a genome region which contains variation number equals to or greater than the threshold, and the variation frequency equals to or greater than the threshold; In Figure 6.2.3(Visualization Result of Multi-genome Gene Variation Analysis), the colored rectangle represents a gene which contains variation number equals to or greater than the threshold, and the variation frequency equals to or greater than the threshold.
In Figure 6.2.2(Visualization Result of Pairwise Substitution Region Analysis), the visualization result will defaultly display reference genome and the first query genome pairwisely, which are "NC_012469" and "NC_014494". The colored rectangle represents a genome region which contains variation number equals to or greater than the threshold, and the variation frequency equals to or greater than the threshold;
You can also save your visualization result in menu "File"-->"Save".
We also use interactions that we have talked in 4.5. User Interaction in Genome Alignment Visualization.
Together with the interactions we talked above, you can also right click on the colored rectangle to see variation information as you can see in Figure 6.2.1, Figure 6.2.2 and Figure 6.2.3.
You can save your visualization into JPG image file, or SVG file, by clicking the menu part of "File".
<< 5.4 |
6.4 >> |
|