Click button "Pan-genome Analysis" in PGAP-X Lite Launcher, you will get the "Pan-genome Analysis" interface like Figure 7.0.1.
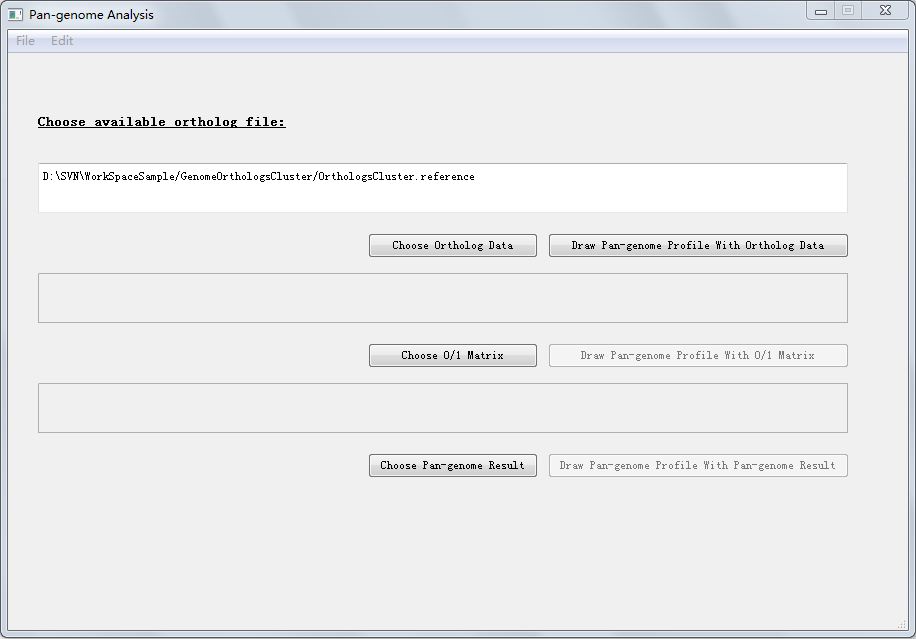
Figuer 7.0.1: Pan-genome Analysis.
| You are here: PGAP-X Home > Manual > Get Pan Genome Profile and Visualization Result | ||||
Click button "Pan-genome Analysis" in PGAP-X Lite Launcher, you will get the "Pan-genome Analysis" interface like Figure 7.0.1.
In Figure 7.0.1, there are three options:
Click button "Draw Pan-genome Profile With Ortholog Data", here we use ortholog clusters file to analysis pan-genome profile. The default ortholog file we used is the result file from "Orthologs Analysis" part, which is in the fold named "GenomeOrthologsCluster" in your workspace, and the file name is exactly "OrthologsCluster.reference". The file format of OrthologsCluster.reference has been introduced in section 5.1. Get Orthologs Analysis Result.
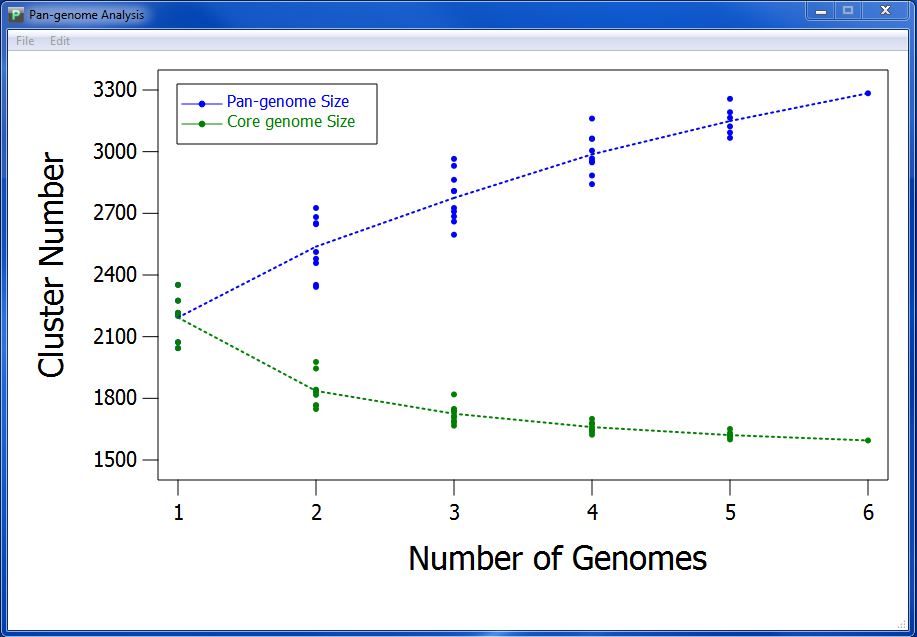
After a few seconds or minutes(time consumed depends on the data amount in your orthologs cluster file), you can get your pan-genome profile like Figure 7.1.1.
Pan-genome profile describes the full complement of genes in a species (typically applied to bacteria and archaea, which can have large variation in gene content among closely related strains). It is the union of the gene sets of all the strains of a species. The significance of the pangenome arises in an evolutionary context, especially with relevance to metagenomics, but is also used in a broader genomics context. Pan-genome profile also includes the "core genome" containing genes present in all strains
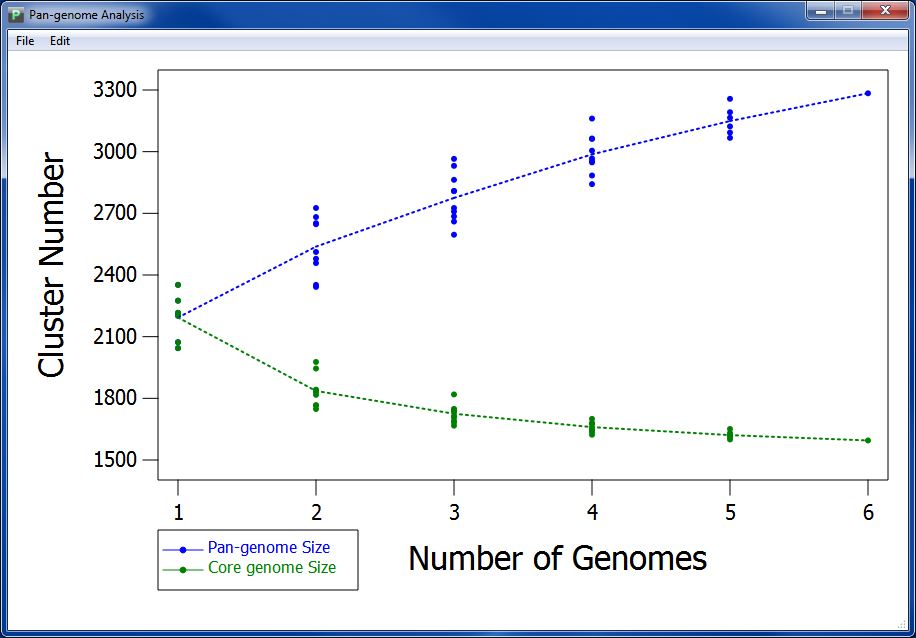
According to pan-genome analysis result, we get the mathematic relation between genome number and pan-genome, genome number and core-genome. We take genome number as abscissa, and draw pan-genome size based on every combination of sampling (as spot) orderly according to genome number. We also calculate the median of pan-genome size, and combine the medians with a dotted line to present variation tendency of pan-genome size. We do the same with core-genome size to visualize the variation tendency.
You can also import other orthologs cluster files, by clicking button "Choose Ortholog Data" the file name can be anything, but the format of your orthologs file should exactly the same as OrthologsCluster.reference, which has been introduced in section 5.1. Get Orthologs Analysis Result .
You can also use 0/1 matrix and pan-genome result file to create pan-genome profile.
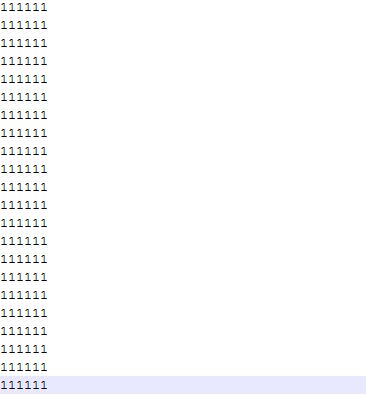
0/1 matrix is a file similar to orthologs cluster file, for each orthologs cluster, if there exist ortholog genes in this specific genome, then there is a 1, other wise there is a 0. Between 0 or 1 there is no blank or tab space, and in 0/1 matirx there is no titile of genome names. Figure 7.2.1 is a sample of 0/1 matrix corresponding to the orthologs cluster file in Figure 5.1.2 in section 5.1. Get Orthologs Analysis Result.
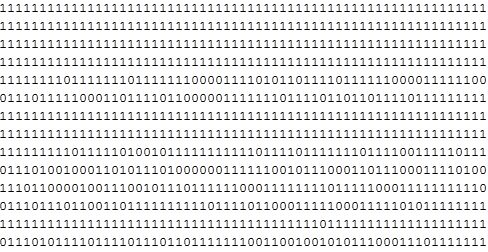
Pan-genome result file is the pan-genome result produced from orthologs clusters file or 0/1 matrix file. Its format is like this:
We introduce several interacting features in pan genome visualization differ from other functional modules.
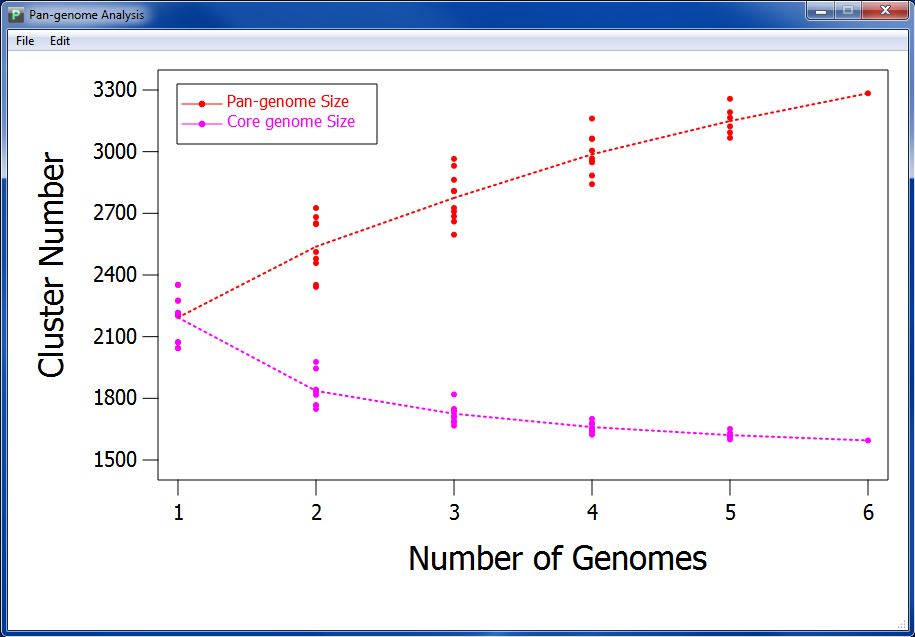
First, you can change the position of legend. Double click the legend, and the mouse will change from arrow to cross, then you can click on the visualization result every where you want to move the legend there. Figure 7.3.1 present the visualization result in which the position of legend is changed.
Third, you can change the name of horizontal ordinate and vertical coordinate by lick menu "Edit"->"Change Axis Name".
You can also save your visualization into JPG image file, or SVG file, by clicking the menu part of "File".
<< 6.4 |
8. Summary >> |
|